
- What Revenue Is at Risk Without Anti-Counterfeiting Protection
- The 5 Categories of Measurable ROI from Anti-Counterfeiting
- How to Calculate Your Baseline Counterfeit Exposure
- Typical ROI Timelines: What Brands See at 3, 6, and 12 Months
- Building the Internal Business Case
- Build Your Business Case in 5 Minutes With the Acviss ROI Calculator
How to Calculate ROI of Anti-Counterfeiting Investment
 Mithileshkumar R NaikMay 19, 202611 min read
- Calculating anti-counterfeiting ROI means weighing implementation cost against lost sales, brand damage, and legal costs from counterfeit activity.
- Most brands underestimate the revenue actually lost to counterfeits because they only count seized units, not undetected diversion.
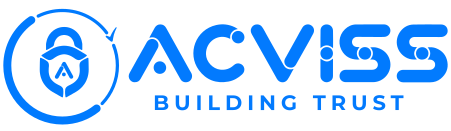
- A 12-month ROI framework should include reduced warranty fraud, recovered market share, and improved customer trust as measurable gains.
- Brands that track counterfeit-driven losses before implementation get a much clearer picture of the investment’s real payback period.
ROI calculations should be grounded in a working definition of brand protection scope, since costs and savings vary by how broadly that scope is drawn — including whether authentication is bought as a one-off system or priced as an ongoing service, covered in our piece on pricing authentication as a service.
The OECD/EUIPO tracks the scale of global trade in counterfeit and pirated goods.

Most anti-counterfeiting investments never get funded. Not because the problem is not real, but because the business case is presented in the wrong frame.
Brand protection is typically pitched as a cost center: “We need to spend X to stop losing Y.” The CFO hears “spend X” and asks what the payback is. The brand manager does not have a clean answer, because the loss from
counterfeiting is diffuse and hard to measure precisely. The meeting ends without approval. The problem continues.
This post is about flipping that frame. Anti-counterfeiting investment is not a security expense. It is a revenue recovery play, a warranty fraud reduction initiative, a supply chain cost reduction project, and a brand equity preservation program. When you model it that way, with a proper baseline, attribution methodology, and realistic timeline, the ROI case becomes fundable.
Here is how to build that case, category by category.
What Revenue Is at Risk Without Anti-Counterfeiting Protection
Before you can calculate a return, you need a credible estimate of the baseline loss. There are five categories of financial exposure that counterfeiting creates for a brand. A clear anti-counterfeiting strategy is what turns that estimate into a plan — see our overview of how Acviss squeezes the counterfeiter’s world down to zero.
Lost direct sales to counterfeit displacement. Every unit of counterfeit product that reaches a buyer who would otherwise have bought genuine is a lost sale. In categories where counterfeiting is widespread, this displacement can be significant. The International Chamber of Commerce estimated the global economic value of counterfeit and pirated goods could reach USD 4.2 trillion by 2022 (ICC/BASCAP, 2016). The sectoral concentration of that loss matters: industries like consumer goods, automotive parts, pharmaceuticals, and electronics carry disproportionate shares of the counterfeit market.
Warranty fraud costs. When counterfeit products enter your distribution channel, some percentage of them result in warranty claims against your brand. A consumer who bought a fake product and experiences a failure does not always know they bought a fake. They submit a warranty claim against the brand name on the product. If your warranty team cannot authenticate the product at the point of claim, you are paying warranty costs on products you never manufactured or sold.
Supply chain costs from grey market and diversion. Grey market goods, genuine products sold outside authorized channels or across geographic markets at arbitrage prices, create distributor conflict, margin erosion, and pricing authority problems. The investigation and resolution of grey market disputes, unauthorized distributor activity, and cross-border diversion involves significant legal, commercial, and operational cost.
Brand value erosion. A brand that is known to be heavily counterfeited loses pricing power over time. If consumers and trade buyers cannot reliably distinguish genuine from fake, the premium that the genuine brand commands is undermined. This is a slow-moving financial damage that does not show up in monthly P&L, but it is real and it compounds. The erosion of pricing power affects every unit you sell, not just the ones displaced by fakes.
Enforcement costs without automation. Manual brand enforcement, monitoring marketplaces, filing individual takedown requests, coordinating legal action against physical counterfeiters, is expensive. Legal fees, investigator fees, and the internal team time required to run manual enforcement programs consume budget that could be deployed more efficiently with the right technology.
The 5 Categories of Measurable ROI from Anti-Counterfeiting

The return from an anti-counterfeiting investment maps directly to each of the five exposure categories above. The key is quantifying each category in terms your finance team can evaluate.
1. Recovered Direct Sales
When counterfeit products are removed from trade channels or when consumers and distributors can verify authenticity at the point of purchase, some percentage of the demand previously satisfied by fakes converts back to genuine product sales. This is not 100% recovery: some buyers chose fakes specifically because of price. But a portion of counterfeit-displaced demand represents buyers who wanted genuine products and were buying fakes because they could not tell the difference or because fakes were the only option available through convenient channels.
The measurable signal here is sales velocity in channels and geographies where authentication was deployed, compared to control channels where it was not. Kitply Industries, which deployed Acviss Certify for product authentication, reported that both production and sales increased following deployment. That outcome reflects demand recovery from reduced counterfeit displacement in their trade channels.
2. Reduced Warranty Fraud Claims
Authentication at the point of warranty claim is one of the clearest ROI calculations in brand protection. If your warranty management system can verify whether a claimed product is genuine before processing the claim, you eliminate the payment of warranty costs on counterfeit products entirely.
The calculation is: (number of warranty claims on counterfeit products per year) x (average warranty cost per claim) = annual warranty fraud cost. If your authentication system eliminates 80% of those claims, that percentage is a direct cost reduction. Acviss Assist is the warranty management product in the Acviss suite, designed precisely for this use case.
3. Supply Chain Cost Reduction
Traceability technology that enables visibility into product movement through authorized channels reduces the cost of grey market investigation and dispute resolution. When you can demonstrate to a distributor where a product was shipped and when, diversion claims are resolvable with data rather than with lengthy investigation. Fewer disputes, faster resolution, lower legal and commercial overhead.
Acviss Origin, the supply chain traceability product, includes geofencing capabilities that generate alerts when product is scanned outside authorized territories. This moves grey market management from reactive investigation to proactive detection.
4. Brand Value Protection
This category is harder to quantify than direct sales or warranty costs, but it belongs in the ROI model because the alternative, unchecked brand equity erosion, has a real P&L consequence over a 3-5 year horizon. A reasonable proxy is the pricing premium your brand commands in the market. If authentication preserves your ability to maintain that premium by reassuring trade buyers and consumers of product genuineness, the value of that preserved premium, applied to your genuine sales volume, is a material number.
5. Enforcement Cost Reduction
Automated marketplace monitoring and takedown workflows replace manual enforcement processes. Truviss, the Acviss online brand protection product, monitors 5,000+ marketplaces and provides the evidence base for takedown requests. The cost comparison is: what your current manual monitoring and enforcement program costs in team time and legal fees, versus the cost of Truviss doing the same work at greater scale. For brands running active online enforcement programs, this is often one of the most straightforward cost reduction calculations in the ROI model.

See Certify in action
See how Certify pays for itself by cutting counterfeit losses within months.
Explore CertifyHow to Calculate Your Baseline Counterfeit Exposure
You cannot model a return without a baseline. The challenge is that counterfeit exposure is not directly observable. Here is a practical approach to estimating it.
Start with industry counterfeit rate data from credible sources. Industry associations, regulatory bodies, and academic research often publish estimates for specific categories. For example, the WHO figure for substandard and falsified medicines in low- and middle-income countries is approximately 10% by volume (WHO, 2023). The OECD estimates that counterfeit goods represent approximately 2.5% of world trade in physical goods (OECD/EUIPO, 2019), with higher rates in specific categories.
Apply that rate to your revenue in affected channels. Not all of your revenue is equally exposed: primary markets with strong distribution control are less exposed than secondary or tertiary distribution, cross-border channels, or markets with known enforcement gaps.
A simplified baseline formula:
Estimated counterfeit exposure = Industry counterfeit rate (%) x Revenue in affected channels x Genuine sale conversion factor (the percentage of counterfeit sales that represent genuine demand, not purely price-driven switching)
This will produce a range rather than a precise figure. That is appropriate. The goal is not a false precision number. It is a defensible estimate that your finance team can stress-test. Work with your sales and channel team to sense-check the estimate against what they observe in the field. Field sales teams almost always have informal knowledge of counterfeit activity that is not captured in any formal report.
Typical ROI Timelines: What Brands See at 3, 6, and 12 Months

Anti-counterfeiting ROI does not materialize uniformly. Different benefit categories have different lead times.
At 3 months: Warranty fraud reduction is often the first measurable benefit to appear. Once authentication is live at the point of warranty claim, fraudulent claims on counterfeit products begin to be rejected immediately. The cost reduction is visible in claims data within the first claim cycle after deployment.
Online enforcement cost reduction also appears quickly for brands deploying automated monitoring. The shift from manual monitoring to automated takedown workflows reduces team time within weeks of go-live.
At 6 months: Channel effects begin to show. Distributors and retailers who have been using the authentication system are now confident in distinguishing genuine product. Sales velocity data starts to reflect this in markets where authentication is being actively used. Grey market alert data gives the supply chain team actionable intelligence that begins reducing diversion-related disputes.
At 12 months: The compounding effects become visible. Recovered sales velocity, brand premium maintenance, reduced warranty fraud, and lower enforcement costs together produce a measurable improvement in the financial picture. Brands that have been running authenticated channels alongside non-authenticated control markets can make a clean comparison at this point.
The 12-month picture is what your finance team will want to see in the business case. Presenting only the year-one ROI is conservative, because the benefit compounds in subsequent years while the investment cost is largely front-loaded.
Several calculation errors appear consistently in brand protection ROI models. Avoiding them makes your business case more credible.
Counting only direct sales displacement. The most common error is treating anti-counterfeiting ROI as purely a “fakes removed, genuine sales recovered” calculation. This ignores warranty fraud, supply chain costs, and enforcement overhead, which together often exceed the direct sales impact, especially for categories with long warranty periods or high warranty claim rates.
Ignoring warranty fraud. Warranty fraud from counterfeit products is systematically undercounted because most warranty management processes do not flag counterfeit claims as a distinct category. They are processed as ordinary claims. Until you have authentication at the point of claim, you do not know how large this number is. Conservative estimates still tend to be significant for categories with meaningful warranty exposure.
Using industry averages without market adjustment. Applying a global or industry-wide counterfeit rate to your entire revenue base produces an estimate that may be too high for your best-controlled markets and too low for your most exposed ones. A segmented approach, by channel, geography, and product category, produces a more defensible number.
Forgetting the cost of doing nothing. ROI models that show the return from investing tend to omit the ongoing cost of not investing. Brand equity erosion, accumulating warranty fraud, and rising enforcement costs are not static. They compound over time. The fully loaded cost comparison should be: cost of anti-counterfeiting program versus cost of the problem as it develops without intervention.
Using a one-year payback as the only metric. A system that costs X and returns 0.8X in year one but 1.5X in year two and 2X in year three has a positive NPV even if it does not pay back in 12 months. Present the multi-year view alongside year one.
Building the Internal Business Case
A credible business case for anti-counterfeiting investment needs four sections, and it helps to frame it against the five concrete steps in our guide to protecting your brand.
Problem size: Baseline estimate of counterfeit exposure by category (direct sales, warranty fraud, supply chain costs, enforcement overhead). Sources cited. Sensitivity ranges shown. Field sales observations referenced as qualitative support.
Solution cost: Full cost of the proposed solution including implementation, integration, label/technology costs at your volume, and ongoing platform fees. Year one and recurring annual costs separated clearly. Comparison to current manual enforcement spend.
ROI projection: Estimated benefit by category, year by year for 3 years. Conservative, base, and optimistic scenarios. Attribution methodology explained so finance can interrogate the assumptions. Reference to comparable deployments where results are available (e.g., Kitply Industries production and sales improvement).
Risk of doing nothing: Projected trajectory of the problem without intervention. This section makes the investment decision a comparison between two paths, not a judgment about whether the investment returns enough. A brand that does nothing does not maintain the status quo. It continues to accumulate losses, warranty fraud costs, and brand equity erosion. The cost of inaction belongs in the model.
Build Your Business Case in 5 Minutes With the Acviss ROI Calculator
If you are building the internal business case for anti-counterfeiting investment, Acviss has an ROI calculator that lets you input your industry, revenue in affected channels, estimated counterfeit exposure, and warranty claim data to produce a projected ROI model.
The calculator is designed for the exact situation this post describes: a brand manager or procurement head who needs a credible number to take to a CFO or budget committee, built from their own data rather than industry generics.
Use our ROI calculator to build your business case in 5 minutes. It is free to use and outputs a model you can bring directly to your finance team.
If you want to walk through the model with our team before presenting it internally, or if you have specific questions about how to attribute value in your category, we are ready for that conversation too.
Talk to our team about building a business case tailored to your brand’s situation.

Calculate what counterfeiting is really costing you
Book a free demo and see the ROI Certify delivers within your first year.
Book a Free DemoRelated reading

How to Reserve and Register a Trademark for Your Brand
A brand name isn’t protected just because you’re using it. Until it’s registered as a trademark, anyone else can file for
How to Remove Counterfeits on Meesho, IndiaMart and Myntra
Most brand protection conversations in India focus on Flipkart and Amazon. Those platforms deserve attention, but